Quantcast
Channel: SQL Server performance tuning – SQL Shack – articles about database auditing, server performance, data recovery, and more
Viewing all 151 articles
Browse latest View live

Understanding the distribution scale of transactional and snapshot replication

$
0
0

Background If an environment chooses to use snapshot or transactional replication, one useful exercise is to ask the technical end user (or client) what they think replication does. If you have access to a white board, you can even ask them to demonstrate what they think replication will do for their data. Generally, these technical […]

The post Understanding the distribution scale of transactional and snapshot replication appeared first on SQL Shack - articles about database auditing, server performance, data recovery, and more.


In-Memory OLTP Series – Data migration guideline process on SQL Server 2014

$
0
0

In this article we will review migration from disk-based tables to in-memory optimized tables. This article assumes that you already understand the pros and cons about In-Memory Technology, for more articles about this, please refer here. There are some options available on SQL Server 2014 and SQL Server 2016 that will help you to identity, […]

The post In-Memory OLTP Series – Data migration guideline process on SQL Server 2014 appeared first on SQL Shack - articles about database auditing, server performance, data recovery, and more.

In-Memory OLTP Series – Data migration guideline process on SQL Server 2016

$
0
0

On the last article about the best modes to move the disk-based tables to using the In-Memory feature we covered all the aspects and styles available on SQL Server 2014. Continuing on the migration process now we’re going to look at some of the new enhancements of makes SQL Server 2016 Data Collector [Transaction Performance […]

The post In-Memory OLTP Series – Data migration guideline process on SQL Server 2016 appeared first on SQL Shack - articles about database auditing, server performance, data recovery, and more.

What is causing database slowdowns?

$
0
0

Why is my database so slow? This query used to be so much faster. Why does it take so long to rebuild my index? How come it was fine last month? Every day I am asked these types of questions by clients. Every day! A lot of database developers and application developers do not realize […]

The post What is causing database slowdowns? appeared first on SQL Shack - articles about database auditing, server performance, data recovery, and more.

Searching the SQL Server query plan cache

$
0
0

Whenever a query is executed in SQL Server, its execution plan, as well as some useful execution data are placed into the plan cache for future use. This information is a treasure trove of metrics that can allow some very useful insight into your server’s performance and resource consumption. Much of this information would be […]

The post Searching the SQL Server query plan cache appeared first on SQL Shack - articles about database auditing, server performance, data recovery, and more.

Insight into the SQL Server buffer cache

$
0
0

When we talk about memory usage in SQL Server, we are often referring to the buffer cache. This is an important part of SQL Server’s architecture, and is responsible for the ability to query frequently accessed data extremely fast. Knowing how the buffer cache works will allow us to properly allocate memory in SQL Server, […]

The post Insight into the SQL Server buffer cache appeared first on SQL Shack - articles about database auditing, server performance, data recovery, and more.

SQL Server indexed views

$
0
0

SQL Server Views are virtual tables that are used to retrieve a set of data from one or more tables. The view’s data is not stored in the database, but the real retrieval of data is from the source tables. When you call the view, the source table’s definition is substituted in the main query […]

The post SQL Server indexed views appeared first on SQL Shack - articles about database auditing, server performance, data recovery, and more.

SQL Server 2014 Columnstore index

$
0
0

By default, SQL Server stores data logically in the tables as rows and columns, which appear in the result grid while retrieving data from any table and physically in the disk in the row-store format inside the data pages. A new data store mechanism introduced in SQL Server 2012, based on xVelocity in-memory technology, in […]

The post SQL Server 2014 Columnstore index appeared first on SQL Shack - articles about database auditing, server performance, data recovery, and more.


Troubleshooting some waits issues

$
0
0

Background On occasion, I’ll see waits that exceed what I expect well above normal and a few of them have some architecture and standards to consider following when troubleshooting, though like most waits’ issues, there can be other underlying factors that are happening as well. In this article, I investigate the three waits ASYNC_NETWORK_IO and […]

The post Troubleshooting some waits issues appeared first on SQL Shack - articles about database auditing, server performance, data recovery, and more.

Monitoring changes in SQL Server using change data capture

$
0
0

Background In multi-user environments, changes may occur frequently to the architecture, data, or overall structure that creates work for other users. In this series, we look at some ways that we can track changes on the data and architecture layer for pin-pointing times, changes, and using the information for alerting, if changes should be kept […]

The post Monitoring changes in SQL Server using change data capture appeared first on SQL Shack - articles about database auditing, server performance, data recovery, and more.

How to handle excessive SOS_SCHEDULER_YIELD wait type values in SQL Server

$
0
0

The SQL Server SOS_SCHEDULER_YIELD is a fairly common wait type and it could indicate one of two things: SQL Server CPU scheduler is utilized properly and is working efficiently There is a pressure on CPU The first thing that has to be properly understood is that the SOS_SCHEDULER_YIELD wait type, even so named, is not […]

The post How to handle excessive SOS_SCHEDULER_YIELD wait type values in SQL Server appeared first on SQL Shack - articles about database auditing, server performance, data recovery, and more.

Troubleshooting the CXPACKET wait type in SQL Server

$
0
0

The SQL Server CXPACKET wait type is one of the most misinterpreted wait stats. The CXPACKET term came from Class Exchange Packet, and in its essence, this can be described as data rows exchanged among two parallel threads that are the part of a single process. One thread is the “producer thread” and another thread […]

The post Troubleshooting the CXPACKET wait type in SQL Server appeared first on SQL Shack - articles about database auditing, server performance, data recovery, and more.

Is this the end of SQL Profiler?

$
0
0

Introduction SQL Server Profiler is still a tool used to monitor our relational databases and our multidimensional ones. We used for performance and security purposes. However, in the SQL Server 2016, they announced that the SQL Profiler will be deprecated in future versions. Figure 0. The SQL Profiler tomb Why is SQL Server Profiler going […]

The post Is this the end of SQL Profiler? appeared first on SQL Shack - articles about database auditing, server performance, data recovery, and more.

Best practices to configure the index create memory setting in SQL Server

$
0
0

Introduction The Index Create Memory setting is an advanced SQL Server configuration setting which the SQL Server database engine uses to control the amount of maximum memory which can be allocated towards the creation of an index. In this article, we will take a look at the steps to resolve the below mentioned error message. […]

The post Best practices to configure the index create memory setting in SQL Server appeared first on SQL Shack - articles about database auditing, server performance, data recovery, and more.

Handling excessive SQL Server PAGEIOLATCH_SH wait types

$
0
0

One of the most common wait type seen on SQL Server and definitely one that causes a lot of troubles to less experienced database administrators is the PAGEIOLATCH_SH wait type. This is one of those wait types that clearly indicates one thing, but which background and potential causes are much subtler and may lead to erroneous conclusions and worse, incorrect solutions

The Microsoft definition of this wait type is:

Occurs when a task is waiting on a latch for a buffer that is in an I/O request. The latch request is in Shared mode. Long waits may indicate problems with the disk subsystem.

To make this simple to understand, lets explain this in an example. When the data pages are requested from the buffer cache by one or multiple sessions, but those data pages are not available in the buffer cache, SQL Server will have to allocate a buffer page for each one in the buffer and it will create the PAGEIOLATCH_SH on the buffer. At the same time, while the page is moved from the physical disk to a buffer cache (a physical I/O operation) SQL Server will create PAGEIOLATCH_EX wait type. Once the page is moved to a buffer cache, since the issued PAGEIOLATCH_SH is still active and the pages can be read from the buffer cache

Page latches are actually light locks that are not configurable, placed by SQL Server internal processes as a way of managing access to the memory buffer. Pahe latches are placed every time that SQL Server has to physically read data from the memory buffer to a hard drive or from hard drive to the memory buffer and the thread must wait until this completes causing the PAGEIOLATCH_XX waits. The moment the requested data pages became available after the I/O reading completes, the thread will get requested data and will continue with execution. So obviously, it is normal to encounter some PAGEIOLATCH_SH waits

So it is clear that the PAGE IOLATCH_SH is directly related to the I/O subsystem, but does this actually mean that in case of excessive PAGE IOLATCH _SH, the I/O subsystem is always the primary/only root cause of the trouble?

In short, the answer is no. The high PAGEIOLATCH_SH, even though it indicates the pressure is on the I/O subsystem, doesn’t necessary mean that I/O subsystem is a bottleneck per se, but it could also mean that I/O subsystem cannot cope with the excessive I/O imposed to it.

To understand this better, let’s dive deeper into the causes of high PAGEIOLATCH_SH which will allow better understanding of this wait type, but will also allow better handling of situations when PAGEIOLATCH_SH is prevalent wait type in SQL Server

  • I/O subsystem has a problem or is misconfigured

  • Logical/physical drive misconception

  • Network issues/network latency

  • Overloaded I/O subsystem by another processes that are producing the high I/O activity

  • Memory pressure

  • Synchronous Mirroring and AlwaysOn AG

  • Bad index management

I/O subsystem has a problem or is misconfigured

The PAGEIOLATCH_SH could indicate a problem with the I/O subsystem, i.e. problem with the disk. It is often possible that faulty disk does not trigger the monitoring system and in fact the disc issues could be very tricky, as disk could experience various issues which are not black and white (work/doesn’t work). Also the drives that are part of the RAID system could be even more trickier to detect considering the RAID own ability to deal with errors. In such cases, checking the S.M.A.R.T. (Self-Monitoring, Analysis and Reporting Technology) log should be the first step. In situations when the SMART log indicates a possible error or even an imminent drive failure, this could be the actual root cause of the excessive PAGEIOLATCH_SH.

For those with RAID controllers, testing the RAID hardware/software for malfunctions or errors is also recommended.

Another issue, very often overlooked is heavily fragmented disk. It’s not rare that defragmenting the disk subsystem resolve the I/O issue

Logical/physical drive misconception

A misconception in using the physical and logical drive is often the cause of a slow and problematic I/O subsystem. Quite often users are distributing a different part of the systems (OS, swap file, SQL Server data files, backups etc.) to a different disk partitions (C:, D:, E:, F: etc.) in order to load balance the I/O subsystem which is completely fine and recommended. But there is often misconceptions between load balancing using physical and logical disk drives. The following use case will help in understanding the problem and a provide potential solution

RAID arrays with multiple discs are quite common in larger organizations. In the following example, the RAID 5 array with 4 hard drives will be taken as an example. The RAID array is further divided into 3 partitions C:, D: and E:

What must be clear here is that those partitions are actually logical, not physical partitions, as they share the same raid array and thus the same four physical disks – logically split RAID 5 array into 3 partitions. The RAID array for an operating system represent the single disk drive and it is not possible for OS to distribute specific data to a specific physical drive. In such scenario, OS, the page/swap file, SQL Server data files and tempDB are share same physical RAID array, namely the same physical drives. In such configurations, the different parts of the software systems are putting the pressure on each other, but also the different parts of the same software can conflict with each other (I.e. different SQL Server processes might be heavily dependent on I/O and thus conflicting to each other. In such a scenario, it is very possible to encounter excessive PAGEIOLATCH_SH as different SQL Server processes as well as different applications and OS processes could severely affect the performance of the I/O subsystem causing the slow transfer of data pages from disk to a buffer pool.

The principles of the RAID system itself will not be explained here any deeper, as it is not of particular interest for understanding the main problem

So instead of having partitions distributed across the same drives, it is actually important having the physical hard drives that will be used for distributing the different parts of the software to ensure the proper load balance of the I/O subsystem

The recommended scenario would be to have enough physical hard drives/RAIDs for distribution of critical parts of the software. The most widely used and recommended scenario would be the following

  • Set the Operating system on a dedicated RAID 1 array as minimum (one physical drive is also acceptable but risky solution)

  • Set the swap file to a dedicated hard drive. No RAID is required here

  • Set TempDB on a dedicated RAID 1 array as minimum. Again, one physical drive is acceptable, but it can pose the risk. TempDB will be recreated on every SQL Server restart, and if there are some SQL Server uptime requirements that consider rarely restarting SQL Server that RAID 1 option should be the first choice

  • Use the RAID 5 partition for the SQL Server data files. Storing the backups on the same RAID array is OK

  • Set the transaction log files on a dedicated RAID 1 array. RAID1 is the recommended for storing the transaction log files

Using this configuration should ensure the minimal I/O pressure and thus the normal values for PAGEIOLATCH_SH but for other PAGEIOLATCH_XX wait types as well

Network issues

For SQL Servers that are based on SAN (Storage Area Network) or NAS (Network Attached Storage) storage systems which are network dependent, every network latency or network slowness might/will cause excessive PAGEIOLATCH_SH (but also the other PAGEIOLATCH_XX waits) wait type values due to inability of the SQL Server to retrieve data from physical storage to a buffer pool fast enough

If the PAGEIOLATCH_SH wait type values are consistently larger than 10-15 seconds, this could be a reliable indicator of pressure on I/O subsystem and three above mentioned causes should be carefully investigated

Overloaded I/O subsystem by another processes that are producing the high I/O activity

In this particular scenario the high I/O activity caused by other processes or subsystems will cause a slightly different representation of the PAGEIOLATCH_SH wait type, and under such scenario, a high number of short PAGEIOLATCH_SH wait types will be displayed. Generally, a high number of brief PAGEIOLATCH_SH wait types is a typical scenario where increased pressure on I/O by another processes should be investigated and resolved

Memory pressure

In an ideal scenario the memory buffer should be big enough to store all the necessary data for work that SQL Server has to perform. In such an ideal scenario, since all the necessary data is stored in the buffer pool, there will be no requirements for physical data read, and the only changes that will be performed would be the buffer pool data updates. Real world scenarios are rarely ideal, so physical I/O readings from storage to a buffer pool and vice versa are inevitable. The fact that SQL Server is performing the physical I/O readings from the storage is not the something that should be of concern as long as SQL Server performance is not affected. This is why it is important for a DBA to create a baseline of the system and as long as the physical I/O reads are within the created baseline no intervention should be required.

What has to be tracked and alerted for is when there is a sudden breach of the high threshold of an established baseline, especially if this occurs without visible reason and it lasts for prolonged period of time. This is almost a certain indicator that SQL Server is suffering from the memory pressure, which could be caused by a different reason including:

  • OS processes are utilizing the larger amount of memory than usually forcing the SQL Server memory manager to reduce the size of the memory buffer. Reduced memory buffer is causing increased amount of lazy writes and read activity

  • A poor performing query that is causing dynamic memory default action to pose internal pressure to a physical memory as a consequence of memory settings change. The same internal pressure on physical memory might be caused due to redistribution of the reserved and stolen pages from the memory buffer

  • Bloated query plan will cause buffer space reduction for the data cache. This is often the cause of the memory pressure so it will be explained with more details here. Query execution plans are stored in the same memory buffer as buffered data. In this way the SQL Server can reuse the execution plan without need for expensive compiling of the query every time it executes, thus relieving the pressure on CPU

    For an execution plan to be reused for a specific query, the T-SQL statement of that query must be identical up to the last character as the one that is stored with the query plan, which is not the case with ad-hock queries.* Parametrized queries, unlike ad-hoc queries, use a parameter instead of the specific value, and thus they do not change when executing with different data values, which means that the stored query plan can be used for each execution. For SQL Servers where a large number of ad-hock queries are executed, there will be increased requirements for memory in order to store the additional query plans, as T-SQL, for these ad-hock queries will be different. The more ad-hock queries that are executed, the more memory for storing the execution plans will be required and thus more buffer memory used. Since query plans for ad-hock queries are used only once, their respective execution plans will be useless and the memory used by those plans will be wasted. But the waste of memory itself is not posing the issue, instead it is the fact that buffer memory allocated to the useless execution plans will be at the expense of the memory used for data pages, which is often referred as the “memory stealing”

    Reduced size of the memory for storing the data pages will force SQL Server to perform physical I/O reading from the disk more frequently, thus causing the direct impact on SQL Server performance and excessive PAGEIOLATCH_SH

When the memory is the cause of the excessive PAGEIOLATCH_SH, whether the to perform performance optimization and tuning of SQL Server or just to add/increase physical memory should be carefully considered. Troubleshooting and performance optimization in such cases can be time consuming and not always efficient in producing desired results. It is not unusual that after spending lots of time in tuning the SQL Server to avoid memory pressure, a DBA to ends up with no solution but to add more physical memory to a system. With the current price of memory, just increasing physical memory size could be not only instant/faster but also a cheaper (compering to the DBA labor) and thus more optimal solution in most cases

Synchronous Mirroring and AlwaysOn AG

In situations when high safety mode is used in database mirroring, or when the synchronous-commit availability mode (synchronous-commit mode) is set for AlwaysOn AG, high availability is emphasized over performance. In this case, high availability is achieved at a cost of increased transaction latency which means that a transaction on the principal server or the primary replica cannot be committed until it receives a message that the mirror or secondary replica that the secondary database enters the SYNCHRONIZED state. In situations when the mirroring operation is delayed for any reason (network, high O/O etc.) it require increased time for physical I/O data reading and thus the PAGEIOLATCH_SH times as the thread will have to wait for the data until the synchronized signal is sent. While this often appears similar to query blocking, the actual root cause of this lies in problems with synchronization

Poor index management

Poor index management is another cause of high incidents PAGEIOLATCH_SH wait types due to forcing the index scan (table scan) instead of index seek. Generally speaking, index seek is always preferred and having index scan in execution plans is something that should be investigated. Having index scan means that no indexes that are relevant to particular query that is executing were found, so SQL Server will have to perform a full table scan, meaning that it will have to read every single row, from first to the last one, in the table. This will cause, in most cases, all pages related to the table have to be read from the disk, meaning that physical I/O reading will be performed – a direct consequence of this will be increased incidents of PAGEIOLATCH_SH wait types. The reason for this could be often that indexes doesn’t exists or that there is a missing or missing/altered nonclustered index that is required by a query.

Excessive CXPACKET wait types present alongside with excessive PAGEIOLACH_SG wait types is often an indicator that index scan is the actual cause of excessive PAGEIOLATCH_SH

A parameter sniffing might also cause the unwanted and unneeded index scan instead of index seek, in situations when the query results could be significantly different for different parameters. During the initial execution and depending on the results retrieved by the query (for example if the retrieved number of rows consist make up a high percent of the total number of rows), SQL Server might decide that it is better to use the index scan instead of the index seek. This means that for every execution of the query, even when the small number of rows is returned the SQL Server will use the same execution plan and it will use index scan, instead of the lighter and faster index seek. Results of this will be increased PAGEIOLATCH_SH wait types due to increased physical I/O reading of the data pages from the disk

So to sum up this article:

  • Even, although fundamentally related to the I/O, excessive PAGEIOLATCH_SH wait types don’t mean necessarily that the I/O subsystem is the root cause. It is often one of the other reasons described in this article

  • Check the SQL Server, queries and indexes as very often this could be found as a root cause of the excessive PAGEIOLATCH_SH wait types

  • Check for memory pressure before jumping into any I/O subsystem troubleshooting

  • Keep in mind that in case of high safety Mirroring or synchronous-commit availability in AlwaysOn AG, increased/excessive PAGEIOLATCH_SH can be expected

* An example of what was explained in the sentence:

  1. As it can be seen in this ad hock query the specific value is used, and the value will be changed when different condition have to be used

    SELECT * FROM dbo.Table1 WHERE CustomerId = 670

  2. Here the parameter is used that will be replaced with original value at the time of execution

    SELECT * FROM dbo.Table1 WHERE CustomerId = @p

So in case number 1, the SQL Server will have to store the execution plan for every query as if different values are used like this:

SELECT * FROM dbo.Table1 WHERE CustomerId = 670

SELECT * FROM dbo.Table1 WHERE CustomerId = 29

When SQL Server compares these T-SQL statements it will identify them as different, as they actually are, so every time we use the new value for CustomerId, it will create a new execution plan and will store it in the buffer

In case of parametrized query:

SELECT * FROM dbo.Table1 WHERE CustomerId = @p

Every time it is executed the query text will be identical, so there is no need for the new execution plan as the T-SQL will not change for different values of CustomerId

Further reading

The post Handling excessive SQL Server PAGEIOLATCH_SH wait types appeared first on SQL Shack - articles about database auditing, server performance, data recovery, and more.


The SQL Server 2014 Resource Governor

$
0
0

SQL Server Resource Governor was introduced in SQL Server 2008. This feature is used to control the consumption of the available resources, by limiting the amount of the CPU, Memory and IOPS used by the incoming sessions, preventing performance issues that are caused by resources high consumption.

The Resource Governor simply differentiates the incoming workload and allocates the needed CPU, Memory and IOPS resources based on the predefined limits for each workload. In this way, the SQL Server resources will be divided among the current workloads reducing the possibility of consuming all resources by single workload type, while competing for the available resources. A minimum resources limit can be also specified in the Resource Governor, which allows you to set the proper resource level for each workload type.

The Resource Governor feature is very useful when you have many databases hosted in your SQL Server and many applications connecting to these databases. These connections are competing for the available SQL Server resources, affecting each other’s performance. Using the Resource Governor feature will overcome this kind of performance issue.

There are three main components that form the Resource Governor; Resource Pools, Workload Groups and the Classifier. Small chunks of the CPU, Memory and IOPS resources are collectively called the Resource Pool. A set of defined connections is known as Workload Group. The component that is responsible for classifying incoming connections to workload groups, depending predefined criteria, is called the Classifier. We will review each these components, in detail, in this article.

Resource Pools represent virtual instances of all of the available SQL Server CPU, Memory and IOPS resources. There are two built-in resource pools created when you install the SQL Server; the Internal Pool, which is used for the SQL Server background tasks, and the Default Pool, which is used to serve all user connections that are not directed to any user-defined resource pool. The internal pool can’t be modified, as it is used for serving SQL Server background processes. If the internal pool needs all the SQL Server available resources for a specific internal task, it will be given priority over all other user-defined pools. SQL Server supports up to 18 user-defined resource pools.

While creating resource pools, you need to specify the CPU, Memory and IOPS minimum and maximum limitations for each pool. The MIN_CPU_PERCENT parameter specifies the minimum CPU used by all requests in the created pool, which takes effect when CPU contentions occur, as the value will be available for other pools if there is no activity in the pool. This value can be between 0 and 100, with the sum of the MIN_CPU_PERCENT value for all pools not more than 100%. The MAX_CPU_PERCENT parameter specifies the maximum CPU used by all requests in the created pool. Same as the MIN_CPU_PERCENT parameter, the MAX_CPU_PERCENT takes effect when CPU contentions occurred, as the value will be available for other pools if there is no activity in the pool. The MAX_CPU_PERCENT value can’t be less than the MIN_CPU_PERCENT value. For the MIN_MEMORY_PERCENT setting, it will be reserved for the pool whether it is used or not, and will not be released for the other pools if there is no activity on that pool, which will affect the overall performance if you set a high value for less frequently used pool. Again the MAX_MEMORY_PERCENT parameter should be more than the MIN_MEMORY_PERCENT value.

Workload Groups are containers for user and system sessions with a common classification type that will be mapped to one resource pool. There are two built-in workload groups created when the SQL Server is installed; internal SQL Server activities are grouped into the Internal Workload Group, which is mapped to the Internal Pool, and user activities that are not directed to any user-defined workload group, which will be grouped into the Default Workload Group that is mapped to the Default Pool.

There are many parameters that you can tune during the workload group creation process, such as specifying the session’s importance within the group, otherwise referred to as IMPORTANCE. Importance is compared and affected to the same resource pool. Importance can be LOW, MEDIUM and HIGH, where MEDIUM is the default value.

  • The REQUEST_MAX_CPU_TIME_SEC parameter specifies the maximum CPU time that can be used by the session. An alert will be raised if the session exceeds that value without interrupting the session. The value 0 indicates no limit for session’s CPU time.

  • The MAX_DOP value specifies that maximum degree of parallelism used by the parallel sessions. This value will override the default server MAXDOP value for the parallel sessions. The MAX_DOP value can be between 0 and 64.

  • The REQUEST_MEMORY_GRANT_TIMEOUT_SEC parameter specifies the maximum time that the query will wait to be granted memory once it is available.

  • The REQUEST_MAX_MEMORY_GRANT_PERCENT specifies the maximum memory that the session can use from the resource pool. The default value for the

    REQUEST_MAX_MEMORY_GRANT_PERCENT is 25.

  • The GROUP_MAX_REQUEST specifies the maximum number of concurrent sessions that can be executed in the workload group.

The Classifier is a function that is used to categorize incoming sessions into the appropriate workload group. Many system functions can be used to classify the incoming sessions such as: HOST_NAME (), APP_NAME (), SUSER_NAME (), SUSER_SNAME (), IS_SRVROLEMEMBER (), and IS_MEMBER (). Only one classifier function can be used to direct the sessions to the related workload group. It is better to keep the classifier function as simple as possible, as it will be used to evaluate each incoming session, and with complex function it will slow down the incoming queries and affect overall performance.

We described each component individually, now we need to combine it all together to know how the Resource Governor works. Simply, once the session connected to the SQL Server, it will be classified using the classifier function. The session will be routed to the appropriate workload group. This workload group will use the resources available in the associated resource pool. The resource pool will provide the connected session with limited resources.

The process of configuring the SQL Server Resource Governor is simple; first you need to create the resource pools, then create a workload group and map it to a resource pool, after that the classification function should be created to classify the incoming requests and finally the resource governor will be enabled with the created classification function.

Let’s start with creating two resource pools, the ServicePool that will be used for the service accounts and the UserPool that will be used for the user accounts as below:

CREATE RESOURCE POOL [ServicePool] WITH(
min_cpu_percent=50, 
		max_cpu_percent=100, 
		min_memory_percent=50, 
		max_memory_percent=100, 
		AFFINITY SCHEDULER = AUTO
)

GO

CREATE RESOURCE POOL [UserPool] WITH(
min_cpu_percent=0, 
		max_cpu_percent=30, 
		min_memory_percent=0, 
		max_memory_percent=30, 
		AFFINITY SCHEDULER = AUTO
)

GO

As you can see, the ServicePool assigned resources more than the UserPool, in order to give priority for the requests coming from the application side over the users’ ad-hoc queries.

Now the two resource pools are ready, we will start creating two workload groups; ServiceGroup that will be mapped to the ServicePool resource pool and the UserGroup that will be mapped to UserPool resource pool, keeping all other parameters with its default values as follows:

CREATE WORKLOAD GROUP [ServiceGroup] 
USING [ServicePool]
GO
CREATE WORKLOAD GROUP [UserGroup] 
USING [UserPool]
GO

To make sure that the changes will take effect, the RECONFIGURE statement should be run as below:

ALTER RESOURCE GOVERNOR RECONFIGURE;
GO

Now that the resource pools and workload groups have been created and configured successfully, ou can now create the resource pools and workload groups simply using SQL Server Management Studio. Expand the Management node from the Object Explorer, then right-click on the Resource Governor and choose New Resource Pools as follows:

The Resource Governor Properties window will be displayed, where you will find two default resource pools in the top grid, the Default and Internal resource pools. You can create the two user-defined resource pools created previously by specifying the pool name and the CPU and Memory min and max limitations. Then by clicking on each created pool, you can create workload groups that will be mapped to the selected resource pool. And finally enable the resource governor by checking the Enable resource Governor checkbox as below:

You will not be able to choose the classifier function that will be used in the previous window as it is not created yet. Refresh the Resource Governor node to check that the resource pools and the workload groups created successfully:

You can also use the sys.resource_governor_resource_pools and sys.resource_governor_workload_groups DMVs to list the created resource pools and workload groups with all settings as in the following simple SELECT statements with the results:

SELECT * FROM sys.resource_governor_resource_pools

SELECT * FROM sys.resource_governor_workload_groups

Now, we will create the classification function that will be used to classify and route the incoming requests to the appropriate workload group. In this example, we will classify the incoming requests depending on the user name as service or normal users, using the SUSER_SNAME() system function as follows:

USE master;
GO
 
CREATE FUNCTION Class_funct() RETURNS SYSNAME WITH SCHEMABINDING
AS
BEGIN
  DECLARE @workload_group sysname;
 
  IF ( SUSER_SNAME() = 'ramzy')
      SET @workload_group = 'UserGroup';
  IF ( SUSER_SNAME() = 'SQLShackDemoUser')
      SET @workload_group = 'ServiceGroup';
     
  RETURN @workload_group;
END;

To enable the Resource Governor using the created classification function, use the ALTER RESOURCE GOVERNOR query below:

USE master
GO
ALTER RESOURCE GOVERNOR WITH (CLASSIFIER_FUNCTION = dbo.Class_funct);
GO
ALTER RESOURCE GOVERNOR RECONFIGURE;

The sys.resource_governor_configuration DMV can be used to make sure that the Resource Governor is enabled as follows:

SELECT * FROM sys.resource_governor_configuration

Congratulations, the Resource Governor is configured successfully and will start catching each connected session, routing the connections from SQLSHACKDEMO user to the ServiceGroup, the connections from Ramzy user to UserGroup, the SQL Server background processes to the Internal workload group and any other connections, to the Default workload group.

The below query can be used monitor the incoming sessions with the workload group for each session except the internal sessions (remove the WHERE clause to monitor all sessions):

USE master
GO
SELECT ConSess.session_id, ConSess.login_name,  WorLoGroName.name
  FROM sys.dm_exec_sessions AS ConSess
  JOIN sys.dm_resource_governor_workload_groups AS WorLoGroName
      ON ConSess.group_id = WorLoGroName.group_id
  WHERE session_id > 60;

The results will be like:

We can also use the performance monitor counters to monitor the Resource Governor. The CPU usage % counter from the SQLServer: Workload Group Stats counters set is used to monitor the CPU usage by all requests in the selected workload group. And the Used memory (KB) performance counter from the SQLServer: Resource Pool Stats counters set retrieves the amount of memory used by each resource pool.

Assume that we will run the below DBCC CHECKDB queries concurrently by the SQLSHACKDEMO and Ramzy users in order to monitor both the CPU and Memory usage per each workload group they belong to:

USE master
 GO
 DBCC checkdb (AdventureWorks2012 )
 GO
 DBCC checkdb (AdventureWorksDW2012 )
 GO
 DBCC checkdb (ApexSQLCrd )
 GO
 DBCC checkdb (ApexSQLMonitor )
 GO
 DBCC checkdb (SQLShackDemo )
 GO

Open the Windows Performance Monitor window from the Administrative tools or by writing Perfomon on the Run window, then click on Plus (+) icon to add the needed performance counters. First we will choose the CPU Usage% counter from the SQLServer: Workload Group Stats counters set for the two user-defined resource pools created previously as follows:

As you can see in the middle part of the result below, the ServicePool represented by the red line is assigned more CPU than the UserPool represented by the green line, as the CPU for the UserPool is limited to 30 percent only. Once the query that is running on the ServicePool finished, the UserPool limitation is overridden and assigned all CPU resources requested by that session to complete the query as appeared in the last part of the below graph. Once both queries are finished, all CPU resources released back to the other pools showing zero CPU percent for both pools below:

To discuss the memory usage on each pool, choose the Used memory (KB) counter from the SQLServer: Resource Pool Stats counters set for the two user-defined resource pools created previously as follows:

It is clear from the middle part of the graph below, that the ServicePool represented by the blue line assigned more memory than the UserPool represented by the purple line during the concurrent run of both sessions. Once the session running in the ServicePool completed, the session running on the UserPool will not override the defined limit and will complete running in the same memory limit. The other thing that we should mention is that, once the sessions are finished, the memory will not be completely released, reserving the minimum memory required for the sessions, although there is no incoming requests on that pools as follows:

The SQL Server 2014 Resource Governor allows you to limit another server resource in addition to the CPU and Memory to manage the server performance, which is the IOPS (Input Output Operations per Second) per volume. If one of your applications performs an intensive IO load, it will affect the overall SQL Server IO performance, slowing down the other applications connecting to that SQL Server. With this new addition in SQL Server 2014, you can control the IO consumption by specifying the MIN_IOPS_PER_VOLUME and MAX_IOPS_PER_VOLUME parameters while creating the resource pool.

Let’s modify the ServicePool and the UserPool that we created in our demo to set the MAX_IOPS_PER_VOLUME value using ALTER RESOURCE POOL query below:

ALTER RESOURCE POOL ServicePool WITH (Max_IOPS_PER_VOLUME=1500);
ALTER RESOURCE GOVERNOR RECONFIGURE;
GO
ALTER RESOURCE POOL UserPool WITH (Max_IOPS_PER_VOLUME=500);
ALTER RESOURCE GOVERNOR RECONFIGURE;
GO

The sys.dm_resource_governor_resource_pools DMV can be used again to check our resource pools settings including the CPU, Memory and IOPS limits as follows:

SELECT pool_id , name, min_cpu_percent ,max_cpu_percent ,min_memory_percent ,max_memory_percent ,min_iops_per_volume ,max_iops_per_volume   from sys.dm_resource_governor_resource_pools

The result will be like:

The Disk Read IO/Sec performance counter from the SQLServer: Resource Pool Stats counters set can be used to monitor the IOPS load for the two user-defined resource pools created previously as follows:

You can see from the below graph how the Resource Governor limits the IOPS used by the UserPool represented by the blue line not to exceed the 500 IOPS, where it allow the ServicePool to exceed that value but limited to 1500 IOPS as per our configuration. Once the sessions finished, both will release the IOPS to the other pools on that SQL Server:

If you arrange to modify the classification function or disable the Resource Governor, you should disconnect the Resource Governor from the classification function by assigning it to NULL as follows:

ALTER RESOURCE GOVERNOR WITH (CLASSIFIER_FUNCTION = null);
GO
ALTER RESOURCE GOVERNOR RECONFIGURE;

Null means that all incoming requests will be routed to the Default pool. To complete disabling the Resource Governor, run the simple ALTER RESOURCE GOVERNOR query below:

ALTER RESOURCE GOVERNOR DISABLE;
GO
ALTER RESOURCE GOVERNOR RECONFIGURE;

You need to make sure that all sessions connected to that SQL server are stopped, in order to completely disable the Resource Governor, and the best way to guarantee that is restarting the SQL Server Service using the SQL Server Configuration Manager.

Conclusion:

The SQL Server Resource Governor enables you to limit the CPU, Memory and recently the IOPS resources requested by the incoming sessions. In this way, you will prevent high resource consuming queries from affecting the performance of other queries and slowing down the applications connecting to the SQL Server.

On the down side, the Resource Governor has few limitations, such as it can be used to limit the resources only for the SQL Server Database Engine, and can’t be configured to limit the other SQL Server components such as Reporting Services, Integration services or Analysis Services. Also, the Resource Governor has no control over system activities that can consume all server resources, and only limit user activities.

Useful Links:

The post The SQL Server 2014 Resource Governor appeared first on SQL Shack - articles about database auditing, server performance, data recovery, and more.

SSRS ReportServer: Service performance counters guide

$
0
0

SSRS performance counters

Measurements of the Reporting Services service (SSRS) monitoring cycle show which resources the reporting process consumes, and also, specific sets of counters show the particular type of the reporting process deployment in use, Native and SharePoint mode. The entire reports processing occurs in the Report Server, which is the core element of SSRS architecture, and among all features, collaboration with SharePoint platform is the most crucial, because of advantages of report processing and generating reports for SharePoint components.

The SSRS service itself has many performance counters, and that is the reason there are three standardized groups of SSRS performance objects:

  1. MSRS 2011 Web Service and MSRS 2011 SharePoint Mode Web Service – these performance objects with their specific performance counters monitor report server performance and its processing on behalf of interactive report viewing tasks.

  2. MSRS 2011 Windows Service and MSRS 2011 Windows Service SharePoint Mode – to monitor scheduled operations and report delivery, these two groups of performance counters track the operations like subscription, delivery, snapshots of report execution, and history of reports processing.

  3. ReportServer:Service and ReportServerSharePoint:Service – these performance counters are the main topic of this article.

SSRS ReportServer:Service performance counters

Performance counters for ReportServer:Service and ReportSharePointServer:Service, as SharePoint part of ReportServer:Service, display specific measurements related to HTTP activity, which regards the web-related events of the Report Server, like requests, connections, logon attempts, and also the memory management events. In reporting process, some of the resources of the Report server will be dedicated to SharePoint components.

There are seven categories of reporting services performance counters:

  1. Connections
  2. Bytes
  3. Errors
  4. Logon
  5. Memory
  6. Requests
  7. Tasks performance counters
  1. Connections performance counter

    • Active connections: this counter shows the number of active connections on the server at the certain time point.

    Note: The value of this performance counter displays as a numeric, it is based on the number of allowed requests (see under Requests performance counters) and there is no default maximum number of connections. Even though there is no limit, too many connections sometimes can overwhelm the memory resources (if user requested too many complex reports processing), and that can interrupt the flow of the reporting process itself.

  2. Bytes performance counters

    • Bytes Received total and Bytes sent total: these counters show the number of bytes received and sent in total by both Report Manager and the Report Server. Values of these counters show as the actual bytes received/sent (46.137.344, which is 44 MB, e.g.).

    • Bytes received/sec and Bytes sent/sec: they display the number of bytes received/sent by the server per second. (2.097.152/s, which is 2 MB/s, e.g.).

    Note: The measurement of this counter updates after the transfer is done, so its value remains at 0 and then the value shows as increased.

  3. Errors performance counters

    • Errors total: this counter displays the number of errors received in total, during the processing of HTTP requests.

    • Errors/sec: as the previous, this counter shows the number of errors received per second.

    Note: These both measurements (displayed as a numeric value, or numeric value/s, 6 or 6/s, e.g.) can show the website issues including level 400 and level 500 errors.

  4. Logon performance counters

    • Logon Attempts Total and Logon Successes Total: these performance counters show the number of logon attempts and logon successful attempts made from Report Services Windows authentication types.

    • Logon Attempts/sec and Logon Successes/sec: they display the number of logon attempts and successful logons per second.

    Note: If the value of Logon Attempts Total and/or Logon Successes Total is 0, Custom (User) authentication is in use. These counters give an insight of how many logon attempts were successful or unsuccessful while logging to the server.

  5. Memory performance counters

    • Memory Pressure state: this counter shows the current stadium of memory resources of the server. There are five values of measurement:

      1 – Memory is not under pressure
      2 – Low level of memory pressure
      3 – Medium level of memory pressure
      4 – High level of memory pressure
      5 – Memory is extremely under pressure

    • Memory Shrink amount: this counter displays the number of bytes, requested by the server to shrink the memory in use. A value of measurement displays as number of bytes (63.963.136, which is 61 MB, e.g.)

    • Memory Shrink Notifications/sec: it displays the number of notifications that the server triggered in the last second to shrink the memory in use. The value of this counter indicates how often the server memory is pressurized. If the value is 0, memory is not pressurized at particular moment.

    Note: If performance issues occur, the combination of Active connections and this performance counter can help in determination of the potential bottleneck. Also, these performance counters are specific for the ReportSharePointServer:Service performance object.

  6. Requests performance counters

    • Requests Disconnected and Requests Not Authorized: these performance counters show the number of requests which failed because of a communication failure and the number of requests, and it triggers the HTTP 401 status code.

    • Requests Executing: this performance counter displays the number of requests in process at the certain time point.

    • Requests Rejected: it displays the number of requests which were not processed due to insufficient server resources. It also returns a HTTP 503 status code (Server is busy).

    • Requests Total: this counters shows the total number of requests logged by the report server from the report manager since startup (or last reboot of the machine). It also summarizes requests sent to Report Manager and those sent from Report Manager to the report server.

    • Requests/sec: it shows the number of processed requests per second. This value represents the current throughput of the application.

    Note: For a single user, maximum number of allowed requests is 20, by default. Also, value 0 indicates no limit to the number of connections. However, this value can be preset with RSReportServer.config feature.

  7. Tasks performance counters

    • Tasks Queued: this performance counter displays the number of requests currently waiting to be processed. Each of the requests made to the report server corresponds to one or more tasks, and this counter is including only tasks that are active at certain time point. Value of this counter displays as a numeric (7, if 7 tasks are queued, e.g.)

    Note: Deep insight on the server’s activity can be done by looking through measurements from Tasks Queued Requests Queued, Requests Executing and Requests Rejected performance counters.

Useful links:

The post SSRS ReportServer: Service performance counters guide appeared first on SQL Shack - articles about database auditing, server performance, data recovery, and more.

Measuring Availability Group synchronization lag

$
0
0

With all of the high-availability (HA) and disaster recovery (DR) features, the database administrator must understand how much data loss and downtime is possible under the worst case scenarios. Data loss affects your ability to meet recovery point objectives (RPO) and downtime affects your recovery time objectives (RTO). When using Availability Groups (AGs), your RTO and RPO rely upon the replication of transaction log records between at least two replicas to be extremely fast. The worse the performance, the more potential data loss will occur and the longer it can take for a failed over database to come back online.

Availability Groups must retain all transaction log records until they have been distributed to all secondary replicas. Slow synchronization to even a single replica will prevent log truncation. If the log records cannot be truncated your log will likely begin to grow. This becomes a maintenance concern because you either need to continue to expand your disk or you might run out of capacity entirely.

Availability modes

There are two availability modes, synchronous commit and asynchronous commit. Selecting a mode is equivalent to selecting whether you want to favor data protection or transaction performance. Both availability modes follow the same work flow, with one small yet critical difference.

With synchronous commit mode, the application does not receive confirmation that the transaction committed until after the log records are hardened (step 5) on all synchronous secondary replicas. This is how AGs can guarantee zero data loss. Any transactions which were not hardened before the primary failed would be rolled back and an appropriate error would be bubbled up to the application for it to alert the user or perform its own error handling.

With asynchronous commit mode, the application receives confirmation that the transaction committed after the last log record is flushed (step 1) to the primary replica’s log file. This improves performance because the application does not have to wait for the log records to be transmitted but it opens up the AG to the potential of data loss. If the primary replica fails before the secondary replicas harden the log records, then the application will believe a transaction was committed but a failover would result in the loss of that data.

Measuring potential data loss

Thomas Grohser once told me, “do not confuse luck with high-availability.” A server may stay online without ever failing or turning off for many years but if that server has no redundancy features then it is not highly-available. That same server staying up for the entire year does not mean that you can meet five nines as a service level agreement (SLA).

Policy based management is one method of verifying that you can achieve your RTOs and RPOs. I will be covering the dynamic management view (DMV) method because I find it is more versatile and very useful when creating custom alerts in various monitoring tools. If you would like to read more on the policy based management method, review this BOL post.

Calculations

There are two methods of calculating data loss. Each method has its own quirks which are important to understand and put into context.

Log send queue

Tdata_loss = log_send_queue / log_generation_rate

Your first thought might be to look at the send rate rather than the generation rate but it is important to remember that we are not looking for how long it will take to synchronize, we are looking for what window of time will we lose data in. Also, it is measuring data loss by time rather than quantity.

This calculation can be a bit misleading if your write load is inconsistent. I once administered a system which used filestream. The database would have a very low write load until a 4 MB file was dropped in it. The instant after the transaction was committed the log send queue would be very large while the log generation rate was still showing very low. This made my alerts trigger even though the 4 MB of data was synchronized extremely fast and the next poll would show that we were within our RPO SLAs.

If you chose this calculation you will need to trigger alerts after your RPO SLAs have been violated for a period of time, such as after 5 polls at 1 minute intervals. This will help cut down on false positives.

Last commit time

Tdata_loss = last_commit_timeprimary last_commit_timesecondary

The last commit time method is easier to understand. The last commit time on your secondary replica will always be equal to or less than the primary replica. Finding the difference between these values will tell you how far behind your replica lags.

Similar to the log send queue method, the last commit time can be misleading on systems with an inconsistent work load. If a transaction occurs at 02:00am and then the write load on the database goes idle for one hour, this calculation will be misleading until the next transaction is synchronized. The metric would declare a one-hour lag even though there was no data to be lost during that hour.

While misleading, the hour lag is technically accurate. RPO measures the time period where data may be lost. It does not measure the quantity of data which would be lost during that time frame. The fact that there was zero data to be lost does not alter the fact that you would lose the last hours’ worth of data. It being accurate still skews the picture, though, because if there was data flowing you would not have had a one hour lag indicated.

RPO metric queries

Log send queue method

;WITH UpTime AS
			(
			SELECT DATEDIFF(SECOND,create_date,GETDATE()) [upTime_secs]
			FROM sys.databases
			WHERE name = 'tempdb'
			),
	AG_Stats AS 
			(
			SELECT AR.replica_server_name,
				   HARS.role_desc, 
				   Db_name(DRS.database_id) [DBName], 
				   CAST(DRS.log_send_queue_size AS DECIMAL(19,2)) log_send_queue_size_KB, 
				   (CAST(perf.cntr_value AS DECIMAL(19,2)) / CAST(UpTime.upTime_secs AS DECIMAL(19,2))) / CAST(1024 AS DECIMAL(19,2)) [log_KB_flushed_per_sec]
			FROM   sys.dm_hadr_database_replica_states DRS 
			INNER JOIN sys.availability_replicas AR ON DRS.replica_id = AR.replica_id 
			INNER JOIN sys.dm_hadr_availability_replica_states HARS ON AR.group_id = HARS.group_id 
				AND AR.replica_id = HARS.replica_id 
			--I am calculating this as an average over the entire time that the instance has been online.
			--To capture a smaller, more recent window, you will need to:
			--1. Store the counter value.
			--2. Wait N seconds.
			--3. Recheck counter value.
			--4. Divide the difference between the two checks by N.
			INNER JOIN sys.dm_os_performance_counters perf ON perf.instance_name = Db_name(DRS.database_id)
				AND perf.counter_name like 'Log Bytes Flushed/sec%'
			CROSS APPLY UpTime
			),
	Pri_CommitTime AS 
			(
			SELECT	replica_server_name
					, DBName
					, [log_KB_flushed_per_sec]
			FROM	AG_Stats
			WHERE	role_desc = 'PRIMARY'
			),
	Sec_CommitTime AS 
			(
			SELECT	replica_server_name
					, DBName
					--Send queue will be NULL if secondary is not online and synchronizing
					, log_send_queue_size_KB
			FROM	AG_Stats
			WHERE	role_desc = 'SECONDARY'
			)
SELECT p.replica_server_name [primary_replica]
	, p.[DBName] AS [DatabaseName]
	, s.replica_server_name [secondary_replica]
	, CAST(s.log_send_queue_size_KB / p.[log_KB_flushed_per_sec] AS BIGINT) [Sync_Lag_Secs]
FROM Pri_CommitTime p
LEFT JOIN Sec_CommitTime s ON [s].[DBName] = [p].[DBName]

Last commit time method

NOTE: This query is a bit simpler and does not have to calculate cumulative performance monitor counters.

;WITH 
	AG_Stats AS 
			(
			SELECT AR.replica_server_name,
				   HARS.role_desc, 
				   Db_name(DRS.database_id) [DBName], 
				   DRS.last_commit_time
			FROM   sys.dm_hadr_database_replica_states DRS 
			INNER JOIN sys.availability_replicas AR ON DRS.replica_id = AR.replica_id 
			INNER JOIN sys.dm_hadr_availability_replica_states HARS ON AR.group_id = HARS.group_id 
				AND AR.replica_id = HARS.replica_id 
			),
	Pri_CommitTime AS 
			(
			SELECT	replica_server_name
					, DBName
					, last_commit_time
			FROM	AG_Stats
			WHERE	role_desc = 'PRIMARY'
			),
	Sec_CommitTime AS 
			(
			SELECT	replica_server_name
					, DBName
					, last_commit_time
			FROM	AG_Stats
			WHERE	role_desc = 'SECONDARY'
			)
SELECT p.replica_server_name [primary_replica]
	, p.[DBName] AS [DatabaseName]
	, s.replica_server_name [secondary_replica]
	, DATEDIFF(ss,s.last_commit_time,p.last_commit_time) AS [Sync_Lag_Secs]
FROM Pri_CommitTime p
LEFT JOIN Sec_CommitTime s ON [s].[DBName] = [p].[DBName]

Recovery time objective

Your recovery time objective involves more than just the performance of the AG synchronization.

Calculation

Tfailover = Tdetection + Toverhead + Tredo

Detection

From the instant that an internal error or timeout occurs to the moment that the AG begins to failover is the detection window. The cluster will check the health of the AG by calling the sp_server_diagnostics stored procedure. If there is an internal error, the cluster will initiate a failover after receiving the results. This stored procedure is called at an interval that is 1/3rd the total health-check timeout threshold. By default, it polls every 10 seconds with a timeout of 30 seconds.

If no error is detected, then a failover may occur if the health-check timeout is reached or the lease between the resource DLL and SQL Server instance has expired (20 seconds by default). For more details on these conditions review this book online post.

Overhead

Overhead is the time it takes for the cluster to failover plus bring the databases online. The failover time is typically constant and can be tested easily. Bringing the databases online is dependent upon crash recovery. This is typically very fast but a failover in the middle of a very large transaction can cause delays as crash recovery works to roll back. I recommend testing failovers in a non-production environment during operations such as large index rebuilds.

Redo

When data pages are hardened on the secondary replica SQL Server must redo the transactions to roll everything forward. This is an area that we need to monitor, particularly if the secondary replica is underpowered when compared to the primary replica. Dividing the redo_queue by the redo_rate will indicate your lag.

Tredo = redo_queue / redo_rate

RTO metric query

;WITH 
	AG_Stats AS 
			(
			SELECT AR.replica_server_name,
				   HARS.role_desc, 
				   Db_name(DRS.database_id) [DBName], 
				   DRS.redo_queue_size redo_queue_size_KB,
				   DRS.redo_rate redo_rate_KB_Sec
			FROM   sys.dm_hadr_database_replica_states DRS 
			INNER JOIN sys.availability_replicas AR ON DRS.replica_id = AR.replica_id 
			INNER JOIN sys.dm_hadr_availability_replica_states HARS ON AR.group_id = HARS.group_id 
				AND AR.replica_id = HARS.replica_id 
			),
	Pri_CommitTime AS 
			(
			SELECT	replica_server_name
					, DBName
					, redo_queue_size_KB
					, redo_rate_KB_Sec
			FROM	AG_Stats
			WHERE	role_desc = 'PRIMARY'
			),
	Sec_CommitTime AS 
			(
			SELECT	replica_server_name
					, DBName
					--Send queue and rate will be NULL if secondary is not online and synchronizing
					, redo_queue_size_KB
					, redo_rate_KB_Sec
			FROM	AG_Stats
			WHERE	role_desc = 'SECONDARY'
			)
SELECT p.replica_server_name [primary_replica]
	, p.[DBName] AS [DatabaseName]
	, s.replica_server_name [secondary_replica]
	, CAST(s.redo_queue_size_KB / s.redo_rate_KB_Sec AS BIGINT) [Redo_Lag_Secs]
FROM Pri_CommitTime p
LEFT JOIN Sec_CommitTime s ON [s].[DBName] = [p].[DBName]

Synchronous performance

Everything discussed thus far has revolved around recovery in asynchronous commit mode. The final aspect of synchronization lag that will be covered is the performance impact of using synchronous commit mode. As mentioned above, synchronous commit mode guarantees zero data loss but you pay a performance price for that.

The impact to your transactions due to synchronization can be measured with performance monitor counters or wait types.

Calculations

Performance monitor counters

Tcost = Tmirrored_write_transactions / Ttransaction delay

Simple division of the mirrored write transactions / sec and transaction delay counters will provide you with your cost of enabling synchronous commit in units of time. I prefer this method over the wait types method that I will demonstrate next because it can be measured at the database level and calculate implicit transactions. What I mean by that is, if I run a single INSERT statement with one million rows, it will calculate the delay induced on each of the rows. The wait types method would see the single insert as one action and provide you with the delay caused to all million rows. This difference is moot for the majority of OLTP systems because they typically have larger quantities of smaller transactions.

Wait type – HADR_SYNC_COMMIT

Tcost = Twait_time / Twaiting_tasks_count

The wait type counter is cumulative which means that you will need to extract snapshots in time and find their differences or perform the calculation based on all activity since the SQL Server instance was last restarted.

Synchronization metric queries

Performance monitor counters method

NOTE: This script is much longer than the previous ones. That was because I chose to demonstrate how you would sample the performance counters and calculate off of a recent period of time. This metric could be accomplished with the up-time calculation demonstrated above as well.

--Check metrics first

IF OBJECT_ID('tempdb..#perf') IS NOT NULL
	DROP TABLE #perf

SELECT IDENTITY (int, 1,1) id
	,instance_name
	,CAST(cntr_value * 1000 AS DECIMAL(19,2)) [mirrorWriteTrnsMS]
	,CAST(NULL AS DECIMAL(19,2)) [trnDelayMS]
INTO #perf
FROM sys.dm_os_performance_counters perf
WHERE perf.counter_name LIKE 'Mirrored Write Transactions/sec%'
	AND object_name LIKE 'SQLServer:Database Replica%'
	
UPDATE p
SET p.[trnDelayMS] = perf.cntr_value
FROM #perf p
INNER JOIN sys.dm_os_performance_counters perf ON p.instance_name = perf.instance_name
WHERE perf.counter_name LIKE 'Transaction Delay%'
	AND object_name LIKE 'SQLServer:Database Replica%'
	AND trnDelayMS IS NULL

-- Wait for recheck
-- I found that these performance counters do not update frequently,
-- thus the long delay between checks.
WAITFOR DELAY '00:05:00'
GO
--Check metrics again

INSERT INTO #perf
(
	instance_name
	,mirrorWriteTrnsMS
	,trnDelayMS
)
SELECT instance_name
	,CAST(cntr_value * 1000 AS DECIMAL(19,2)) [mirrorWriteTrnsMS]
	,NULL
FROM sys.dm_os_performance_counters perf
WHERE perf.counter_name LIKE 'Mirrored Write Transactions/sec%'
	AND object_name LIKE 'SQLServer:Database Replica%'
	
UPDATE p
SET p.[trnDelayMS] = perf.cntr_value
FROM #perf p
INNER JOIN sys.dm_os_performance_counters perf ON p.instance_name = perf.instance_name
WHERE perf.counter_name LIKE 'Transaction Delay%'
	AND object_name LIKE 'SQLServer:Database Replica%'
	AND trnDelayMS IS NULL
	
--Aggregate and present

;WITH AG_Stats AS 
			(
			SELECT AR.replica_server_name,
				   HARS.role_desc, 
				   Db_name(DRS.database_id) [DBName]
			FROM   sys.dm_hadr_database_replica_states DRS 
			INNER JOIN sys.availability_replicas AR ON DRS.replica_id = AR.replica_id 
			INNER JOIN sys.dm_hadr_availability_replica_states HARS ON AR.group_id = HARS.group_id 
				AND AR.replica_id = HARS.replica_id 
			),
	Check1 AS
			(
			SELECT DISTINCT p1.instance_name
				,p1.mirrorWriteTrnsMS
				,p1.trnDelayMS
			FROM #perf p1
			INNER JOIN 
				(
					SELECT instance_name, MIN(id) minId
					FROM #perf p2
					GROUP BY instance_name
				) p2 ON p1.instance_name = p2.instance_name
			),
	Check2 AS
			(
			SELECT DISTINCT p1.instance_name
				,p1.mirrorWriteTrnsMS
				,p1.trnDelayMS
			FROM #perf p1
			INNER JOIN 
				(
					SELECT instance_name, MAX(id) minId
					FROM #perf p2
					GROUP BY instance_name
				) p2 ON p1.instance_name = p2.instance_name
			),
	AggregatedChecks AS
			(
				SELECT DISTINCT c1.instance_name
					, c2.mirrorWriteTrnsMS - c1.mirrorWriteTrnsMS mirrorWriteTrnsMS
					, c2.trnDelayMS - c1.trnDelayMS trnDelayMS
				FROM Check1 c1
				INNER JOIN Check2 c2 ON c1.instance_name = c2.instance_name
			),
	Pri_CommitTime AS 
			(
			SELECT	replica_server_name
					, DBName
			FROM	AG_Stats
			WHERE	role_desc = 'PRIMARY'
			),
	Sec_CommitTime AS 
			(
			SELECT	replica_server_name
					, DBName
			FROM	AG_Stats
			WHERE	role_desc = 'SECONDARY'
			)
SELECT p.replica_server_name [primary_replica]
	, p.[DBName] AS [DatabaseName]
	, s.replica_server_name [secondary_replica]
	, CAST(ac.mirrorWriteTrnsMS / CASE WHEN ac.trnDelayMS = 0 THEN 1 ELSE ac.trnDelayMS END AS DECIMAL(19,2)) sync_lag_MS
FROM Pri_CommitTime p
LEFT JOIN Sec_CommitTime s ON [s].[DBName] = [p].[DBName]
LEFT JOIN AggregatedChecks ac ON ac.instance_name = p.DBName

Wait types method

NOTE: For brevity I did not use the above two-check method to find the recent wait types but the method can be implemeneted, if you chose to use this method.

;WITH AG_Stats AS 
			(
			SELECT AR.replica_server_name,
				   HARS.role_desc, 
				   Db_name(DRS.database_id) [DBName]
			FROM   sys.dm_hadr_database_replica_states DRS 
			INNER JOIN sys.availability_replicas AR ON DRS.replica_id = AR.replica_id 
			INNER JOIN sys.dm_hadr_availability_replica_states HARS ON AR.group_id = HARS.group_id 
				AND AR.replica_id = HARS.replica_id 
			),
	Waits AS
			(
			select wait_type
				, waiting_tasks_count
				, wait_time_ms
				, wait_time_ms/waiting_tasks_count sync_lag_MS
			from sys.dm_os_wait_stats where waiting_tasks_count >0
			and wait_type = 'HADR_SYNC_COMMIT'
			),
	Pri_CommitTime AS 
			(
			SELECT	replica_server_name
					, DBName
			FROM	AG_Stats
			WHERE	role_desc = 'PRIMARY'
			),
	Sec_CommitTime AS 
			(
			SELECT	replica_server_name
					, DBName
			FROM	AG_Stats
			WHERE	role_desc = 'SECONDARY'
			)
SELECT p.replica_server_name [primary_replica]
	, w.sync_lag_MS
FROM Pri_CommitTime p
CROSS APPLY Waits w

Take-away

At this point, you should be ready to select a measurement method for your asynchronous or synchronous commit AGs and implement baselining and monitoring. I prefer the log send queue method for checking on potential data loss and the performance monitor counter method of measuring the performance impact of your synchronous commit replicas.

References

The post Measuring Availability Group synchronization lag appeared first on SQL Shack - articles about database auditing, server performance, data recovery, and more.

Reducing SQL Server ASYNC_NETWORK_IO wait type

$
0
0

The ASYNC_NETWORK_IO wait type is one of those wait types that can be seen very often by DBAs, and it can be worrisome when excessive values occur, as it is one of the most difficult wait types to fix.

It is important to know that ASYNC_NETWORK_IO name is adopted starting from SQL Server 2005, while in SQL Server 200 this wait type is known as NETWORKIO. The original name of this wait type originates from the period of the slow Ethernet speeds of 10 megabits and 100 Megabits that are commonly in use until the mid-2000s

In most cases excessive values for this wait type are not actually related to any network issues (or it is a very rare case), especially in today’s very fast Ethernet speeds of 40 Gigabit or 100 Gigabit, and those of 200 Gigabit and 400 Gigabit speed that are under development at the moment.

Excessive ASYNC_NETWORK_IO waits could occur under two scenarios:

The session must wait for the client application to process the data received from SQL Server in order to send the signal to SQL Server that it can accept new data for processing. This is a common scenario that may reflect bad application design, and is the most often cause of excessive ASYNC_NETWORK_IO wait type values

Network bandwidth is maxed out. A clogged Ethernet will cause the slow data transmission back and forth from the application. This, in and of itself, will degrade the efficiency of the application.

A problem with the client application

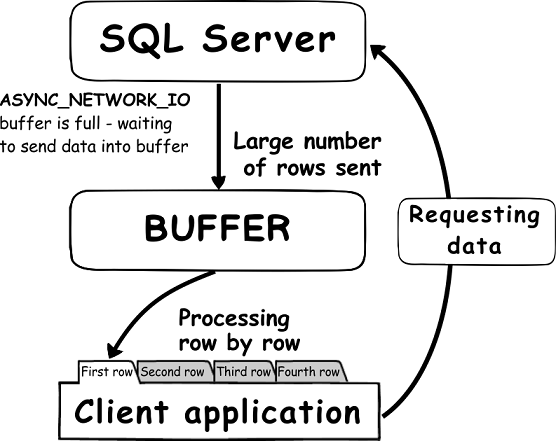
The most common reason for excessive SQL Server ASYNC_NETWORK_IO wait types is that the application cannot process the data that arrives from SQL Server fast enough. When an application requests large data result sets, slow data processing will cause data buffers to be filled, thus preventing SQL Server from sending new data to the client. Row by Agonizing Row (RBAR) processing is often the cause of such behavior and high ASYNC_NETWORK_IO wait type values. In RBAR application programming, only one row at a time is processed from the result set sent by SQL Server. In such a scenario, the complete result set, available for processing, is cached and then SQL Server is notified that the data set has been “processed”. This will allow SQL Server to send a new data set while the application is processing the data from the cached results set

When an application that is using the RBAR processing is forced to work with a very large database environment (VLDB), it will often encounter issues in processing data. The server process (SPID) that is executes the batch will be forced to wait until the application manages to start processing the data stored in the buffer allowing SQL Server to send the new result set to the client (via buffer). And while waiting to send a new data requested by the application to a buffer for further processing it generates the ASYNC_NETWORK_IO wait type.

So what DBAs can do when they encounter high ASYNC_NETWORK_IO wait type values on SQL Server? This involves investigating the application that is causing the excessive ASYNC_NETWORK_IO wait type values and often the coordinating with the application developers who created it. While investigating the excessive ASYNC_NETWORK_IO wait type values, the following should be checked

  1. Check whether the application is requesting large data sets from a SQL Server instance, and then if it filters those data on the client side. Pay attention to third-party applications like Microsoft Access or ORM software (aka Object relational mapping) for example, that may be requesting the large data sets that they are filtering on the client side. Using the read immediately and process afterwards programing method may often save users from excessive ASYNC_NETWORK_IO wait type values

  2. Make sure that appropriate views are created for the client application, as this can ensure that data filtering is done by the SQL Server instance and therefore the significantly lower amount of data will be send to the client application

  3. Make sure that the application is committing the opened transactions and that it committing them in a timely manner

  4. Check if there is the way to reduce the requested dataset in a way to perform data filtering on the SQL Server directly

  5. In case of individual or ad-hock queries, make sure that WHERE clause is added wherever it is possible and that query is properly optimized in a way to restrict the requested data set to only the required data

  6. Check if it possible to use “TOP n” in the query to decrease the row number that will be returned by the query

  7. Scalar-Valued User Defined Functions (UDF) are often the cause of the high ASYNC_NETWORK_IO wait type due to RBAR, so look for any instances of these objects that may be affecting performance

  8. Using a Computed Column Defined with a User Defined Function (UDF) with a large database is another frequent reason for the high ASYNC_NETWORK_IO wait type due to RBAR

  9. In case of SQL Server 2016, it is possible to use natively compiled UDFs that can significantly lower RBAR in most cases and to improve the execution speed up to 100%. This can be particularly useful in situations when refactoring UDF to a Table-Valued Function is not an option

Note:

SQL Server Management Studio is an infamous client application for its reputation of generating ASYNC_NETWORK_IO wait type. SSMS reads the data stream in one row at a time and dealing with each row before retrieving the next row

In addition, there are some other things that can be done by tweaking of SQL Server directly when it is needed to deal with situations when excessive ASYNC_NETWORK_IO waits values are encountered even when during the huge data loads processing on SQL Server side:

  • Enable Shared memory protocol for that SQL Server instance if it is not already done
    Use the following query to determine the protocol used for the current connection:

    SELECT net_transport
    FROM sys.dm_exec_connections
    WHERE session_id = @@SPID;

  • Make sure that client is connected using net_transport=’Shared memory’

If everything above is checked and SQL Server is still hit by high ASYNC_NETWORK_IO wait values, then it is the time to check potential network related issues that might cause such behavior. There are different causes that are generally caused by physical network limitation, malfunction or simple because of wrong network setup. The following should be carefully inspected in order to troubleshoot the network caused ASYNC_NETWORK_IO waits

Problems with the network

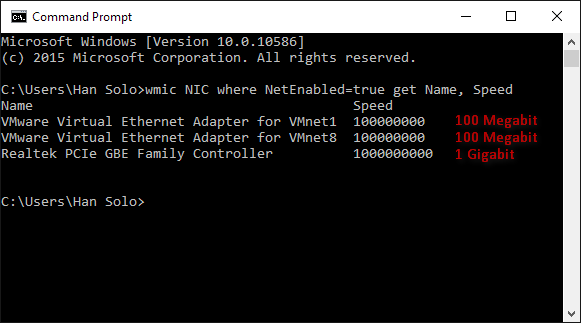
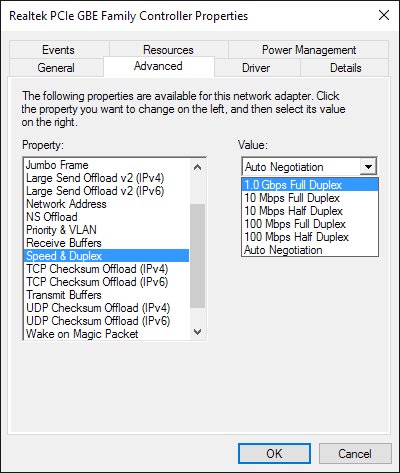
  • Check network bandwidth between the SQL Server and client. Slow network adapters with bandwidth that does not correspond to the estimated amount of data that should be processed on the client side is the often reason for high ASYNC_NETWORK_IO waits values. 100 Megabits adapters are still present and they often cannot answer to demands of modern SQL Server databases and the amount of data processed. Even switching to 1 Gigabit adapters still leaves the system below current requirements in many environments. Using 10 Gigabits network adapters is something that is considered as a minimum for most environments, while 200 Gigabits and 400 Gigabits are something that many enterprises will have to switch in the near future, if they didn’t do that already

  • Make sure that all network components between the SQL Server instance and the client, such as routers, switches, cables are properly configured, fully functional and dimensioned according to required bandwidth

  • Review the Batch requests per second counter values, as this could often indicate the reason for high ASYNC_NETWORK_IO waits. When Batch Requests are examined, what has to be examined is the number of T-SQL batches processed by SQL server since this is what will determine the number of batches SQL Server is processing per second. Servers with Batch Requests per second value larger than 1000 are considered as “busy”. The recommended value could be heavily dependent on the actual system configuration, activity level, and number of transactions being processed. It is not uncommon that this value can be significantly higher during peak hours

    When the Batch requests per second counter value is close or larger than 3,000 is encountered on a 100 Megabits network, this is almost certainly an indication that network speed is the bottleneck and resulting in the high ASYNC_NETWORK_IO waits values. With servers hitting easily over 20,000 Batch requests per seconds in these days, it is smart to consider upgrading 1 Gigabits or lower networks to 10 Gigabits to meet the increasing demands for SQL Server data processing

  • Checking the NIC bandwidth utilization is prudent, even often overlooked.

    Using Perfmon it is easy to calculate the network utilization via the formula:

    Network utilization %= ((Total Bytes\Sec * 8)/current bandwidth) * 100

    If values are larger than 60% on regular basis, switching to a faster network adapter/network bandwidth is highly advisable in order to ensure that enough bandwidth can be allocated when needed for data processing

  • Make sure that Auto Negotiate of the NIC is detecting the network bandwidth properly

    To check the current speed of all active network connection, use the following CLI command

    wmic NIC where NetEnabled=true get Name, Speed

    In case that Auto negotiation for a specific adapter is not picking the correct network speed, it is possible to set up the NIC speed manually in the NIS properties

Useful resources:

The post Reducing SQL Server ASYNC_NETWORK_IO wait type appeared first on SQL Shack - articles about database auditing, server performance, data recovery, and more.

What is a SQL Server deadlock?

$
0
0

Introduction

In this series I will provide all of the information you need to understand in order to deal with deadlocks.

In part 1 (this article) I will explain:

  • what a deadlock is

  • the different types of deadlocks

  • how SQL Server handles deadlocks

What exactly is a deadlock?

A deadlock occurs when 2 processes are competing for exclusive access to a resource but is unable to obtain exclusive access to it, because the other process is preventing it. This results in a standoff where neither process can proceed. The only way out of a deadlock is for one of the processes to be terminated. SQL Server automatically detects when deadlocks have occurred and takes action by killing one of the processes known as the victim.

Deadlocks do not only occur on locks, from SQL Server 2012 onward , deadlocks can also happen with memory, MARS (Multiple Active Result Sets) resources, worker threads and resources related to parallel query execution.

How do I know if I have a deadlock?

The first sign you will have of a deadlock is the following error message which will be displayed to the user who own the process that was selected as the deadlock victim.


Msg 1205, Level 13, State 51, Line 6
Transaction (Process ID 62) was deadlocked on lock resources with another process and has been chosen as the deadlock victim. Rerun the transaction.

The other user whose process was not selected as the victim, will be most likely be completely unaware that their process participated in a deadlock.

Types of deadlocks

There are 2 different types of deadlocks.

Cycle locks

A cycle deadlock is what happens when a process A which is holding a lock on resource X is waiting to obtain an exclusive lock on resource Y, while at the same time resource B is holding a lock on resource Y and is waiting to obtain an exclusive lock on resource X.


Figure 1: Image of a cycle lock

Conversion locks

A conversion deadlock occurs when a thread tries to convert a lock from one type to another exclusive type but is unable to do so because another thread is already also holding a shared lock on the same resource.

There are 3 types of conversions locks in SQL Server.

Type Name Description
SIU Share with Intent Update The thread holds some shared locks but also has update locks on some components (page or row).
SIX Share with Intent Exclusive The thread has both a shared lock and an exclusive lock on some components (page or row).
UIX Update with Intent Exclusive Both a U lock and an IX lock are taken separately but held at the same time.

How SQL Server handles deadlocks

The lock manager in SQL Server automatically searches for deadlocks, this thread which is called the LOCK_MONITOR looks for deadlocks every 5 seconds. It looks at all waiting locks to determine if there are any cycles. When it detects a deadlock it chooses one of the transactions to be the victim and sends a 1205 error to the client which owns the connection. This transaction is then terminated and rolled back which releases all the resources on which it held a lock, allowing the other transaction involved in the deadlock to continue.

If there are a lot of deadlocks SQL Server automatically adjusts the frequency of the deadlock search, and back up to 5 seconds if deadlocks are no longer as frequent.

How does SQL Server choose the victim?

There are a couple of factors which come into play here. The first is the deadlock priority. The deadlock priority of a transaction can be set using the following command:

SET DEADLOCK_PRIORITY LOW;

The typical values for the deadlock priority are:

Priority Value Result
LOW -5 If other transactions have a priority of NORMAL or HIGH or numerically higher than -5 , this transaction will be chosen as the deadlock victim
NORMAL 0 This is the default priority. The transaction could be chosen as the victim if other transactions have a priority higher than 0.
HIGH 5 This process will not be selected as the victim unless there is a process with a numeric priority higher than 5.
<numeric> -10 to 10 This can be used to manage deadlock priority at a more granular level.

If the transactions involved in a deadlock have the same deadlock priority, the one with the lowest cost is rolled back. In example the one where the least amount of transaction log has been used, indicating that there is less data to roll back.

Keeping track of deadlocks

There are various tools that can be used to obtain the details of deadlocks. These include trace flags 1204 and 1222. You can also capture the deadlock graph event using SQL Profiler.

Personally I find that when I suspect that deadlocking is occurring in my server, that setting up and extended event session to log the deadlock graph each time it happens is the easiest.

From SQL Server 2012 onwards this can be done in SQL Server Management Studio under Management \ Extended Events:


Figure 2: Setting up an Extended Events Session to capture deadlocks

Using extended events you will be able to see quite easily how frequently deadlocks occur in your database, and immediately have the deadlock graph available for each deadlock which occurred in order to help you resolve it.

How to minimize deadlocks

Here are a couple of tips to minimize deadlocks

  1. Always try to hold locks for as short a period as possible.

  2. Always access resources in the same order

  3. Ensure that you don’t have to wait on user input in the middle of a transaction. First get all the information you need and then submit the transaction

  4. Try to limit lock escalation, by using hints such as ROWLOCK etc

  5. Use READ COMMITTED SNAPSHOT ISOLATION or SNAPSHOT ISOLATION

Resolving deadlocks

Resolving deadlocks can be a tricky business, and is beyond the scope of this article. Look out for my next articles which explains how to read the deadlock graph which is the most useful in understanding the cause of your deadlock and will give you the insight on how to tackle a deadlock.

References

The post What is a SQL Server deadlock? appeared first on SQL Shack - articles about database auditing, server performance, data recovery, and more.

Viewing all 151 articles
Browse latest View live